


Table of Contents
Why one ROAS number doesn’t cut it
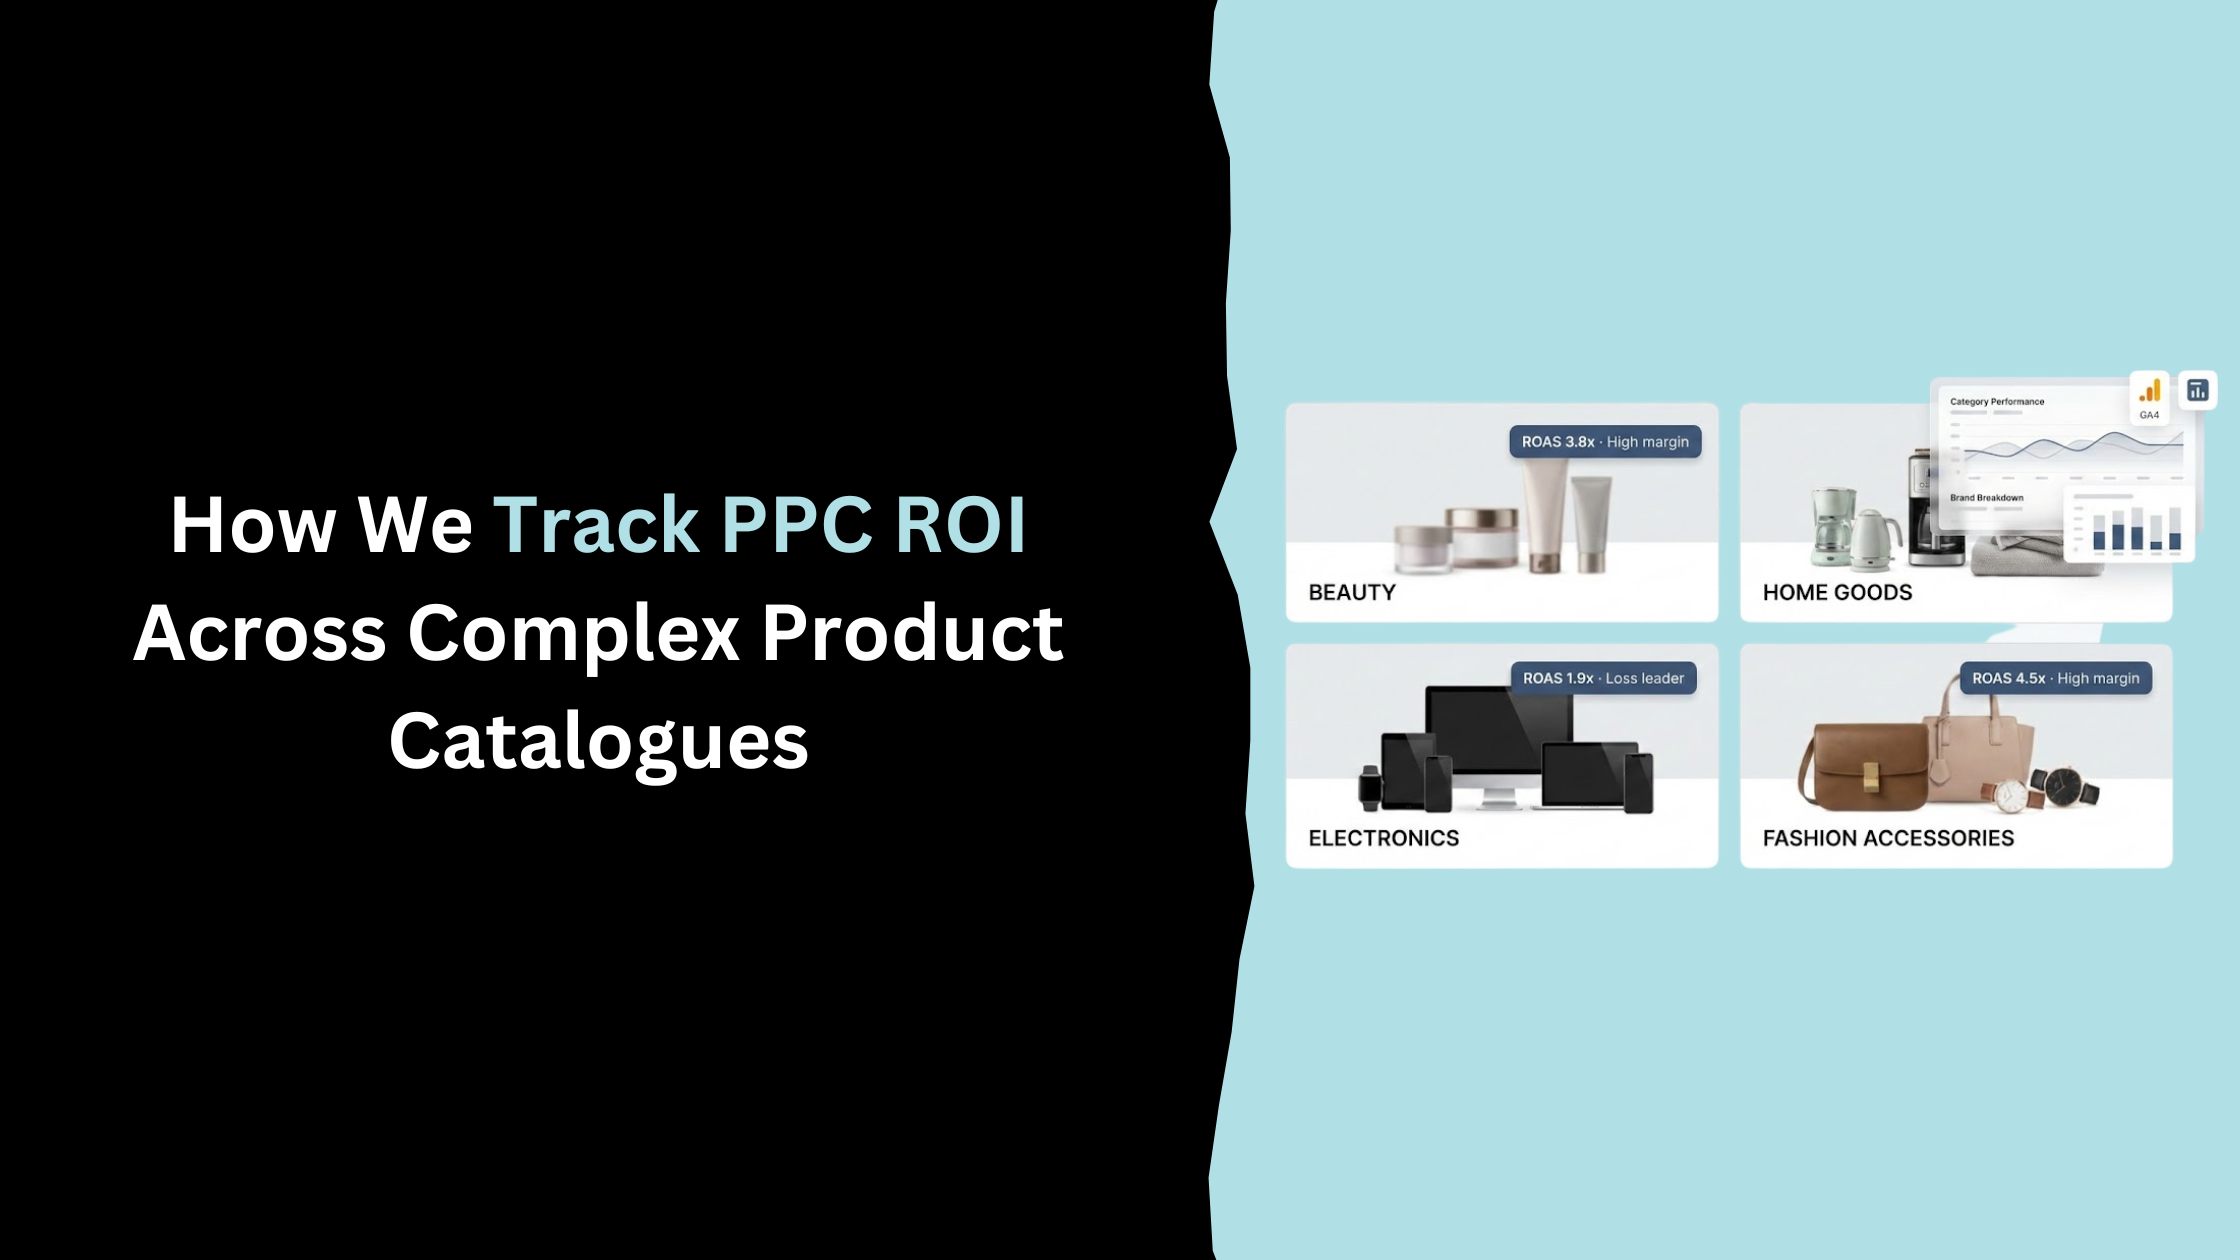
If you sell across lots of categories and brands, a single account-level ROAS is almost meaningless.
Your high-margin ranges, loss-leaders, seasonal lines and B2B buyers all behave differently, but standard reports mash them into one number and call it a day.
That’s how good campaigns get cut and bad ones look better than they are.
When we talk about “realistic ROI tracking” for eCommerce PPC, we mean a setup that shows which ranges really pay you back, not just which campaign happens to get the last click.
Step 1: Fix tracking before you chase ROI
You can’t measure ROI by category if the data is shaky. We start by making sure tracking is solid.
For Glitterbels, a B2B nail brand, GA4 on its own wasn’t enough thanks to cookie limits and patchy channel data.
We implemented server-side tracking with Elevar, routed key events through a first-party endpoint and switched to a data-driven attribution model in GA4. That delivered 100% session, channel and campaign tracking accuracy, unlocked clear new-customer reporting by channel, and helped drive a 25% increase in new customer acquisitions alongside 20% year-on-year revenue growth.
Because events are fired server-side, GA4 has cleaner inputs, so attribution models aren’t guessing as much or throwing everything into “direct”.
Only once we trust the numbers do we start carving them up by product range.
Step 2: Report by category and brand, not just campaign
Next, we align tracking with how you think about the business.
Instead of one master ROAS, we set up views that break performance down by:
- Product category and sub-category
- Brand or collection
- New vs returning customers
- Campaign type (brand, generic, Shopping/PMax, remarketing)
For Euronics, this meant they could see exactly how different product lines and local campaigns were performing, rather than lumping “electronics” into one pot.
With that structure in place, paid media drove a 97% increase in online revenue year on year, while ROAS rose from 9.81 to 13.8, even though media spend went up by 40%.
The key point: category-level ROI is visible, so budget shifts from vague “best performing campaign” thinking to “best performing product range at acceptable profit”.
Step 3: Optimise for profit and margin, not just ROAS
ROAS is fine as a top-line signal, but it hides a lot.
A campaign with 400% ROAS on low-margin accessories might be less valuable than a 250% ROAS campaign that sells high-margin core products.
Where clients share margin data, we:
- Group categories into margin bands or priority tiers.
- Set different target ranges for high- and low-margin products.
- Protect new customer acquisition activity even when short-term ROAS looks lower.
This lines up with how we talk about performance in our eCommerce analytics and AI reporting work: the aim is to move money towards lifetime value and profit, not just tidy percentage figures.
Once this is in place, a “good” result is no longer “ROAS is up”; it’s “we grew high-margin category revenue by X% at target profit”.
Step 4: Use attribution models that match real journeys
Last-click attribution turns complex journeys into a single touchpoint story.
Someone might first click a generic “best [product] for X” query, come back on a brand term, browse a few times via organic, then finally convert after a remarketing ad.
If we only credit the last click, early-stage and mid-funnel campaigns get undervalued and media shifts away from them.
To avoid that, we use:
- Server-side tracking to feed cleaner data into GA4, so events are more complete and less likely to be misattributed or lost.
- Data-driven attribution in GA4, which shares credit across touchpoints using machine learning instead of a fixed rule.
- Assisted conversion and path reports, so we can see which campaigns regularly appear in journeys even if they rarely get the final click.
- Platform-side view-through data, especially on Meta, to understand when ads influence sales without always getting a direct click-to-purchase.
On Glitterbels, this was the difference between “social looks expensive” and “social is clearly driving high-value first purchases that search then close”, which backed the decision to expand TikTok, Snapchat and Meta alongside Google Ads.
The outcome: budget moves based on the full journey, not just the last touch.
Step 5: Pull offline and long journeys into the picture
Some products sell fast; others don’t.
Beds, large appliances, high-ticket electronics – these often involve long comparison cycles and offline steps.
In our work with Euronics, the website was only one part of the sales engine.
We were asked to grow both online revenue and in-store sales, so we:
- Measured performance for users who searched with local intent and later visited stores.
- Used aggregated mobile location data to identify spikes in store footfall during and after local campaigns.
This meant we could show not just “online sales are up”, but “these specific campaigns are helping people find and visit physical stores”, which changed how the wider marketing team and leadership saw PPC.
For longer-consideration products, we also track:
- Repeat purchases and the time between orders.
- Category-level contribution to LTV where that data is available.
That gives a more honest view of ROI for categories that might look “weak” on first-order ROAS but build strong long-term value.
Step 6: Turn all of this into clear, usable reports
None of this matters if the reporting is impossible to read.
Each client gets a view that matches their business questions, usually split into:
- A summary: overall spend, revenue, ROAS, and key changes.
- A category/brand view: performance by product range, including ROAS, profit where available, and new vs returning.
- A journey view: assisted conversions, attribution notes, and any offline signals we’re tracking.
- A short list of actions: what we’ve changed, what we’re testing next, and where we’re moving budget.
For Glitterbels, this sits alongside a server-side tracking setup and AI-driven analytics, so the team can rely on the numbers while still seeing the story behind them.
For Euronics, it means they can see exactly how paid media supports both web sales and local store visits during important retail periods.
What this means if you’re running a big catalogue
If you’re running PPC across lots of categories and brands, “realistic ROI tracking” means:
- You can see performance by category and brand, not just by campaign name.
- Targets reflect margin and role in the journey, not just a flat ROAS.
- Attribution is built on cleaner GA4 data from server-side tracking, and aligned with how people actually buy.
- Offline and long-term value aren’t ignored just because they’re harder to measure.
That’s the standard we hold ourselves to.
Otherwise, you’re making big budget calls off a single blended number that tells you almost nothing about what’s really working.
Get in touch today
complete the form below for an informal chat about your business

We are a small, but perfectly formed, Digital Marketing Agency based in Stoke-on-Trent, Staffordshire. We provide services that help business owners make more money online.