


Table of Contents
Google Ads Performance Max (PMax) campaigns deliver across every major Google surface - Search, YouTube, Display (including Gmail/Discover), Shopping, Maps - and use machine learning to optimise for your chosen conversion goal. But until recently, marketers had little visibility into which channels contributed what. With Google’s new channel‑level reporting, you now have better insight, and that opens the door to smarter optimisation. (See Google’s announcement: “Channel performance reporting …”)
This guide takes you step‑by‑step through what metrics you can see, how to interpret them, and what actionable tactics you can implement to steer your campaign toward better ROI across channels.
Understanding Channel Distribution in Performance Max
What does “channel” mean inside PMax?
PMax is designed to cover multiple Google channels - for example:
- Search (text ads, shopping)
- YouTube (video ads)
- Display Network (image, rich media, dynamic remarketing)
- Gmail and Discover (feed/network placements)
- Google Maps / Local (if store‑goals apply)
Because PMax uses one campaign budget and one automated bidding algorithm, channel delivery is not manually set by you. Instead, the AI allocates spend across these surfaces based on predicted conversion value per auction.
Why this matters
Since you can’t (yet) set individual channel bids inside PMax, the only way to influence channel delivery is via inputs: assets, audience signals, feed quality, landing pages, and conversion tracking. Understanding how channels are performing gives you a feedback loop on whether those inputs are delivering as expected.
The “black‑box” challenge
Historically, many advertisers treated PMax like a “set‑and‑forget” tool because they lacked transparency of surface contribution. The new channel performance report gives you a peek into that.
That said, visibility doesn’t equal full control. Google still emphasises that PMax optimises for marginal ROI across channels, meaning an individual channel may look worse (higher CPA) but still be the right marginal conversion to buy.

Where to Find Channel‑Level Performance Data
Accessing the report
- In Google Ads, go to your PMax campaign.
- Navigate to Campaigns → Insights & Reports → Channel Performance.
- The report is structured in three main sections:
- Performance Summary (overall campaign stats)
- Channels‑to‑Goals Visualisation (shows each channel’s contribution to goals)
- Channel Distribution Table (impressions, clicks, conversions, cost by channel)
- Performance Summary (overall campaign stats)
What the table shows
The distribution table lets you view metrics such as:
- Impressions by channel
- Clicks/interactions by channel
- Conversions attributed to channel
- Conversion value (if enabled)
- Cost (newer enhancements now include cost per channel)
You can segment further (e.g., “ads using product data”, “video ads”, by device/time) for deeper granularity.
Key diagnostics status column
In the table there’s a “Status” column that may show items like:
- “Not eligible” (channel cannot serve)
- “Eligible (Limited)” (some issue)
- “Eligible” (no issues)
Hovering or clicking gives you diagnostic detail (e.g., “Missing video assets for YouTube channel”, “Feed issues on Shopping channel”). These diagnostics are crucial to spot constraints in your campaign.
Attribution Challenges in Performance Max
Marginal ROI & automation
One of the most important caveats: PMax doesn’t aim to optimise for each channel individually; it optimises across all channels for the highest incremental conversion value. Google states: “Average ROI/CPA of individual channels can be misleading”.
This means: even if a channel shows high CPA, it may still be part of the optimal mix if it helps trigger conversions elsewhere.
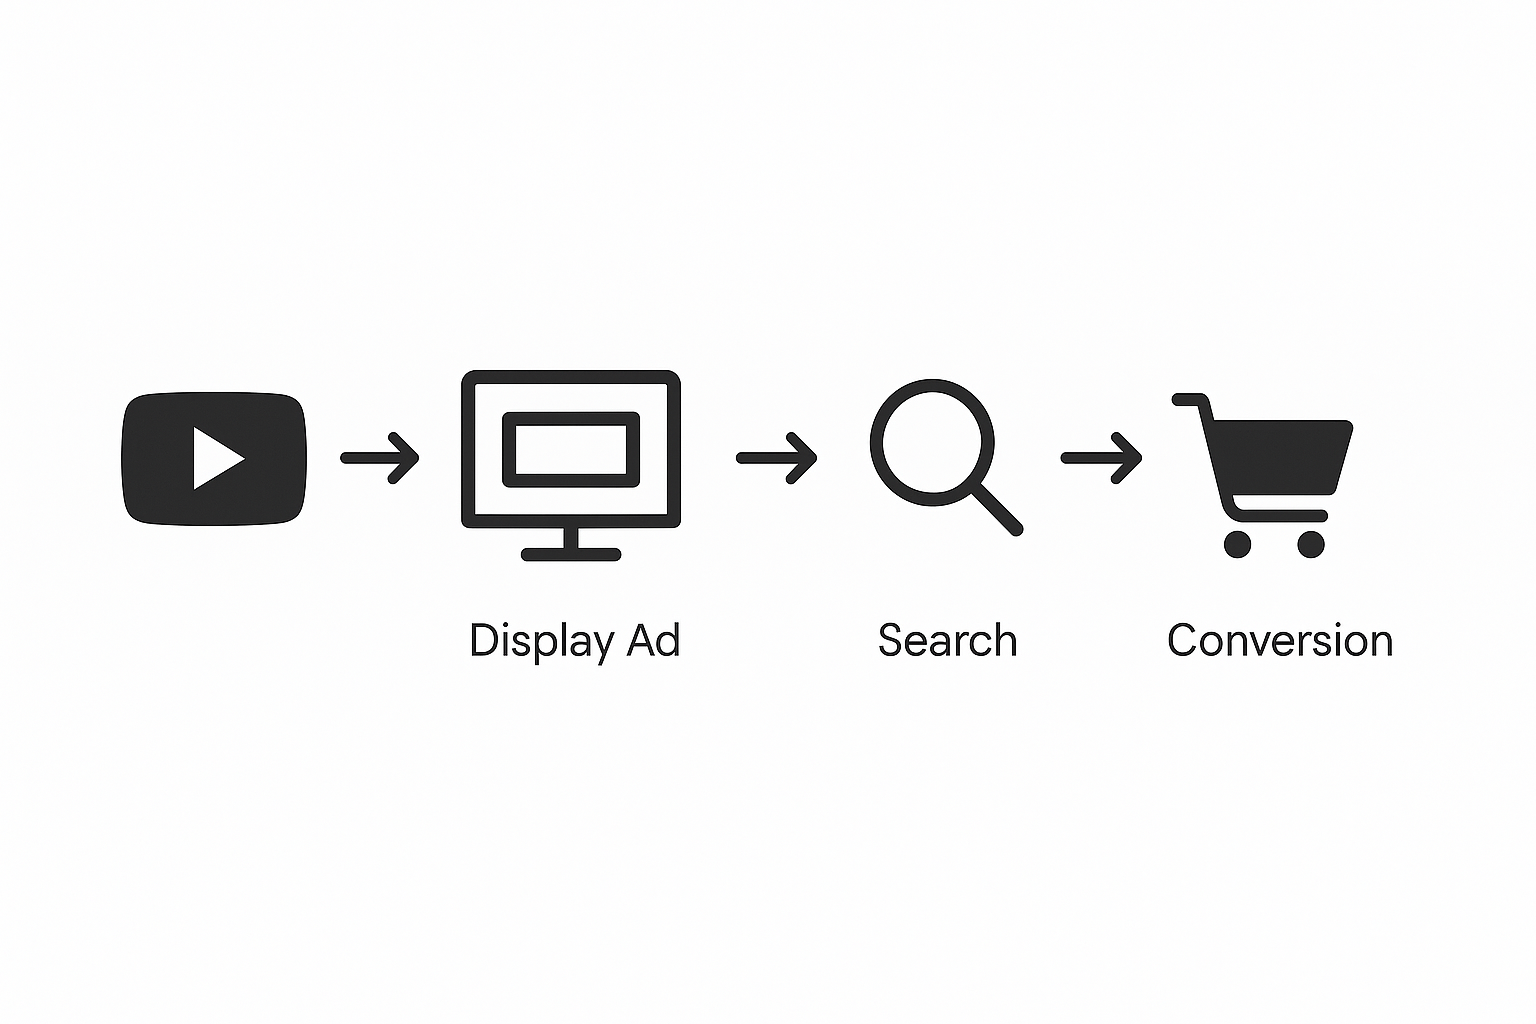
Cross‐channel journeys
Today’s user may see a video on YouTube, later a Display ad, then convert via Search. If PMax attributes the final conversion to Search, you may underestimate the earlier channels’ contribution. The channel breakdown helps, but remember the journey is multi‑touch.
Beware of “Other” or blended buckets
Even with the new reporting, some placements may still be grouped or served in “Other” or “Unclassified” segments. Use the diagnostics and channel table trends to infer hidden costs/gains.
How to Analyse and Optimise by Channel
1. Identify channel strengths & weaknesses
- Use the distribution table to compare conversion value (or CPA) by channel.
- Look at spend by channel: Are you over‑investing in a low‑return channel?
- Use diagnostics: Are any channels “Limited” due to creative/asset issues?
For example, if YouTube cost is high and conversions low, you might need better video assets or reconsider audience signals.
2. Influence channel delivery via inputs
Since you cannot directly bid by channel in PMax, influence comes through:
- Creative assets: Provide strong video + image + text + product feed assets. For example, YouTube and Display require video or visually appealing assets. Without them a channel may be underserving.
- Audience signals: Supply first‑party audience lists/custom segments to help Google understand your target and favour relevant channels.
- Feeds & landing pages: For retail, your product feed and landing pages affect Search and Shopping performance inside PMax. If feed data is weak, a Shopping channel underperforming may drag overall performance.
- Budget/bidding targets: If your target ROAS or CPA is too aggressive, algorithms may prioritise the most efficient channel (even if small) and restrict others. Relaxing targets may broaden delivery.
3. Creative refresh & channel‑specific asset strategy
- For YouTube/Display: Provide 15‑30s videos, strong branding, visual storytelling.
- For Search/Shopping surfaces: Use product‑specific assets, clear value propositions, and feed optimisation.
- For Discover/Gmail: Visual assets plus concise messaging aligned with the feed environment.
When the channel distribution table shows low impressions on a channel, it often means an asset or eligibility issue (e.g., no video asset means YouTube may be underserving). Use the status diagnostics.
4. Structural segmentation for insights
Even though you run one PMax campaign, you can create asset groups to help isolate channel effects:
- Segment by audience type (new vs returning)
- Segment by product category or business unit
- Experiment with separate PMax campaigns for awareness (video-heavy) vs conversion (product-heavy) and compare channel distribution.
Such structure gives you clarity into which asset groups/channels are delivering best.
5. Exclusions and negative controls (brand leakage)
Although you can't exclude entire channels, you can still apply controls:
- Account‑level or campaign‑level negative keywords (especially to prevent PMax overlapping with your branded Search campaign).
- Placement exclusions at account level (e.g., excluding certain app categories or content types may reduce low‑quality Display traffic).
- Brand‑exclusion lists in your PMax campaign to avoid your own brand queries being cannibalised.
6. Use channel insight to inform other campaigns
If you detect that PMax is giving strong results on one channel (say Shopping) and weaker on another (say Display), you can do one of two things:
- Accept and optimise within PMax.
- Or launch separate standard campaigns for the weaker/stronger channels to take more manual control, and set PMax to focus on broad intent and cross-channel assistance.
This way, you blend automation (PMax) with manual tactics (e.g., a dedicated Display campaign) for better overall reach and control.
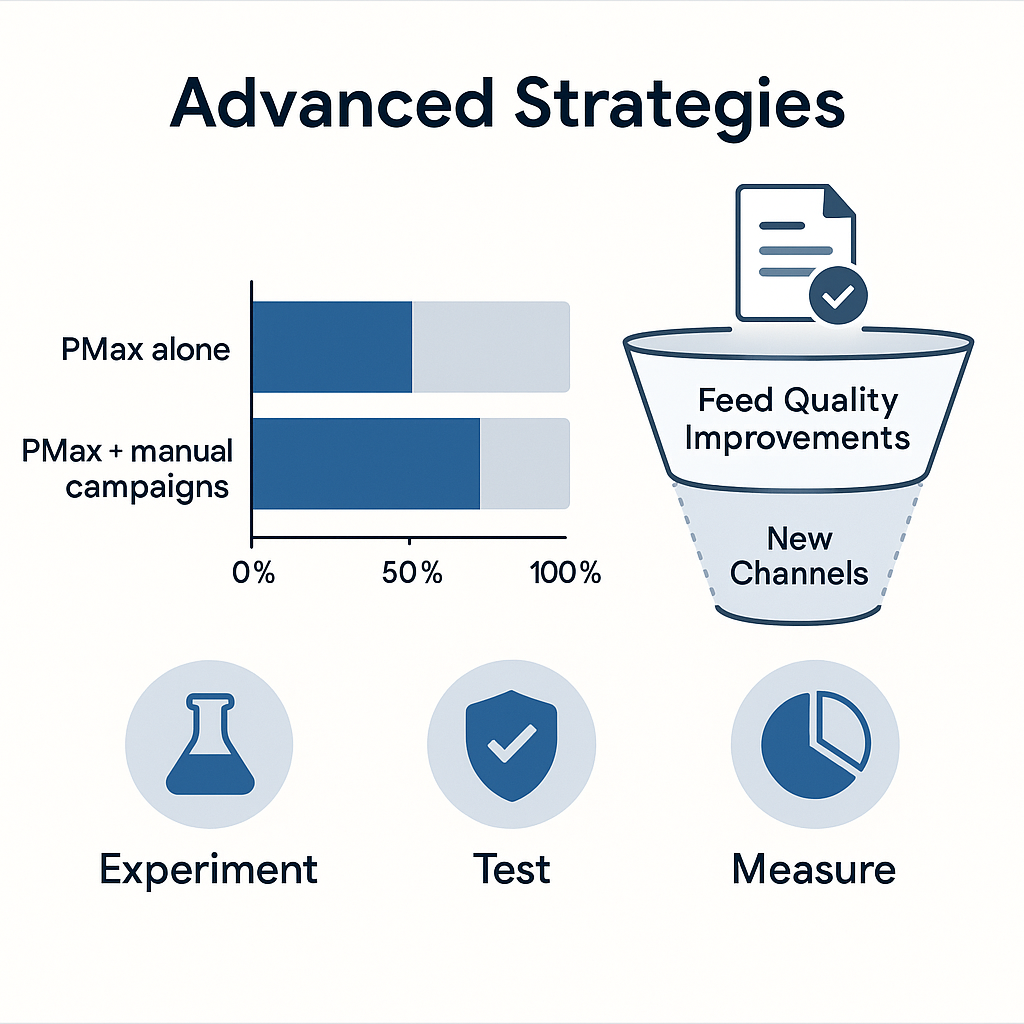
Advanced Strategies for Channel Control Inside PMax
Rethink campaign stack & budget allocation
In many accounts, PMax is treated as a “catch‑all”, but over time, this may lead to budget cannibalisation of other high‑performing campaign types (Search, Shopping). Use the channel performance report to answer:
- Is PMax delivering on channels with higher CPA than my Search campaign?
- Would budget be better allocated to Search and PMax rather than PMax alone?
If you notice that PMax is driving a large volume of low-value conversions via Display, consider reallocating your budget or excluding high-volume, low-value segments.
Experimentation using PMax vs channel‑specific campaigns
One effective approach is to run an experiment where you duplicate a PMax campaign and exclude a specific channel (e.g., exclude Display placements via an account-level placement list) to test the incremental lift. Use channel reporting to measure the difference.
Even though you cannot bid by channel, channel‑specific campaigns let you isolate the effect and decide whether to rely fully on PMax or supplement with manual campaigns.
Leverage feed & asset improvements to unlock channel potential
For example, if Shopping ads (Search surface) look strong but Display placements are limited, look at feed quality: missing GTINs, disapproved products, poor imagery, or missing dynamic remarketing tags. The diagnostics will flag this in channel status.
Similarly, if your YouTube channel impressions are low, maybe you are missing a video asset category or the asset group has lower Ad Strength (good/excellent). Google explicitly recommends achieving good/excellent ad strength across assets.
Attribution modelling and high‑value conversions
If you’re optimising for leads rather than immediate purchases (e.g., B2B service), you might need to shift your primary conversion action from “lead submitted” to “qualified lead”. Google recommends:
- Use enhanced conversions for leads to provide better data to AI.
- Use Maximise conversion value or target ROAS rather than just maximise conversions.
This impacts how PMax allocates across channels: channels that drive early‑stage awareness (e.g., YouTube) may help enable the downstream high‑value conversion, even if their immediate CPA is higher.
Real‑World Use Cases: Channel Optimisation in Action
Use Case 1: Retail (Product Feed + Shopping Focus)
A mid‑sized online retailer found that their PMax campaign had strong volume but declining ROAS. Using the new channel report, they saw the Search/Shopping channel drove 70 % of conversions, but Display and YouTube combined were consuming ~40 % of the budget with low value.
Action: They improved feed quality, refreshed product images, added video assets, and decreased target ROAS slightly to allow more Display breadth. Over the course of three weeks, the Display budget share dropped to 20% and the overall ROAS improved by 18%.
Use Case 2: Lead‑Gen (B2B Service)
A B2B consultancy running PMax was acquiring many form fills, but lead quality was poor. The channel report showed YouTube and Discover generating many leads, but with very low MQLs downstream.
Action: They changed their conversion goal to “qualified lead”, installed enhanced conversions, applied audience signals for high‑intent lists, and excluded a broad placement category in Display. Within 4 weeks, the cost per qualified lead fell 27%, while volume remained stable.
Use Case 3: Local Business (Brick‑and‑Mortar + Maps)
A regional retailer used PMax to drive store visits and online purchases. The channel view revealed that Maps placements were barely showing due to missing store location assets. Diagnostics indicated “Not eligible – missing location assets” for Maps.
Action: They added accurate store locations, enabled local inventory feed, and refreshed local‑aware creative (store imagery). Over the course of a month, the Maps channel climbed to 15% of conversions and improved the cost-per-store-visit by 22%.
Tools and Metrics to Monitor Channel Impact
Key metrics
- Impressions, clicks, and click‑through‑rate (CTR) by channel
- Conversions & conversion value by channel
- Cost and cost‑per‑conversion (CPA) by channel
- Conversion value/Cost (ROAS) by channel - newly available in channel report enhancements.
- Asset‑group level metrics: Ad Strength, asset performance by format (video vs image)
- Diagnostics status for each channel (eligibility, feed/asset issues)
- Budget and spend distribution across channels (indirect via channel report)
- Segments by device/time/day to see if particular channels are dominant in certain contexts.
Using external tools
- Integrate with GA4 to enrich channel data with user behaviour, segments, and downstream conversions not captured in Google Ads.
- Use data export from the channel table (downloadable) for deeper analysis in Excel/Data Studio.
- Use third‑party attribution tools (e.g., Triple Whale, Taggrs) to align PMax channel data with multi‑touch attribution models.
Monitoring cadence
- Weekly: check channel distribution and status diagnostics for emerging issues.
- Monthly: compare channel evolution, creative asset refresh requirements, and budget shifts.
- Quarterly: evaluate whether channel mix aligns with business goals (awareness vs conversion) and decide if you need to launch supplementary campaigns (Search, Display, Video) outside PMax.
Summary: Best Practices for Channel Optimisation in Performance Max
- Diversify and optimise assets: Ensure you provide video, image, text, and feed elements so all channels have the opportunity to serve.
- Use the channel performance report regularly: Spot which surfaces are delivering value and which are lagging.
- Treat channel insights as guidance, not rigid rules: Remember, marginal ROI logic means not all channels will look equal.
- Segment asset groups and audiences to create clearer signals and isolate performance by product/category/intent.
- Apply exclusions and negative controls where necessary (brand queries, app placements) to protect efficiency and avoid cannibalisation.
- Use creative and feed updates to unblock limited channels: missing or poor assets often cause channels to under‑serve.
- Align your measurement and bidding goals with your business outcome (e.g., qualified lead, high‑value purchase) so the algorithm can optimise correctly.
- Blend automation with manual strategy: Use PMax for broad cross‑channel automation, but supplement with manual campaigns if certain channels consistently underperform or require tighter control.
- Communicate findings internally: Channel reporting gives you a stronger narrative for budget allocation, asset refresh, and campaign strategy.
Frequently Asked Questions
Can I exclude specific channels (like YouTube) inside Performance Max?
No - you cannot directly exclude or bid by channel. PMax's allocation is automated. But you can apply negative keywords, placement exclusions at the account level, or adjust target ROAS/CPA to influence delivery.
My channel report shows high cost but few conversions. Should I turn off that channel?
Not necessarily. Because of marginal ROI logic, a high‑cost channel may be enabling conversions later via another channel. Instead, investigate asset quality, audience signals, or placement suitability. If diagnostics show “eligible (limited)”, address the root issue.
How often should I check the channel report?
At a minimum, weekly to monitor major shifts and status issues. Bi‑weekly or monthly for deeper analysis and creative/feed refresh decisions.
Will channel reporting always be available in my account?
It’s being rolled out gradually. Google describes the feature as beta, and availability may vary by account/region.
Do I still need separate Search or Shopping campaigns if I’m using PMax?
Possibly yes. If you compare performance and find that your Search or Shopping campaigns outperform the PMax allocation for those surfaces, you might retain them for control and use PMax for broader reach. Channel reporting helps you decide this.


Get in touch today
complete the form below for an informal chat about your business


We are a small, but perfectly formed, Digital Marketing Agency based in Stoke-on-Trent, Staffordshire. We provide services that help business owners make more money online.