


Table of Contents
.png)
Why Traditional KPIs Fall Short
Most eCommerce KPI dashboards are cluttered with vanity metrics - metrics that look good but tell you almost nothing about profitability. Metrics like impressions, click‑through rate (CTR), and even ROAS are popular because they’re easy to surface, but they aren’t designed to answer the real question: Is your marketing driving profit?
The Difference Between Revenue Metrics and Profit Metrics
- Revenue metrics (like ROAS) tell you top‑line output - revenue generated per dollar spent.
- Profit metrics tell you bottom‑line contribution - how much profit remains after all costs.
Without tracking profitability, brands can fall into traps like:
- Spending heavily on ads with high ROAS but low margin
- Optimising for conversions without regard to customer value
- Focusing on opens and clicks without revenue attribution
To truly manage eCommerce growth, you need KPI systems that:
- Tie to unit economics
- Reflect customer economics (CAC, LTV)
- Are actionable on weekly and monthly cadences
- Improve decision‑making for investment, optimisation, and scaling
This guide gives you a robust framework to do exactly that.
KPI Fundamentals: The Economics Behind Profit
Before we define specific KPIs, let’s establish the core economic concepts that KPIs should measure.
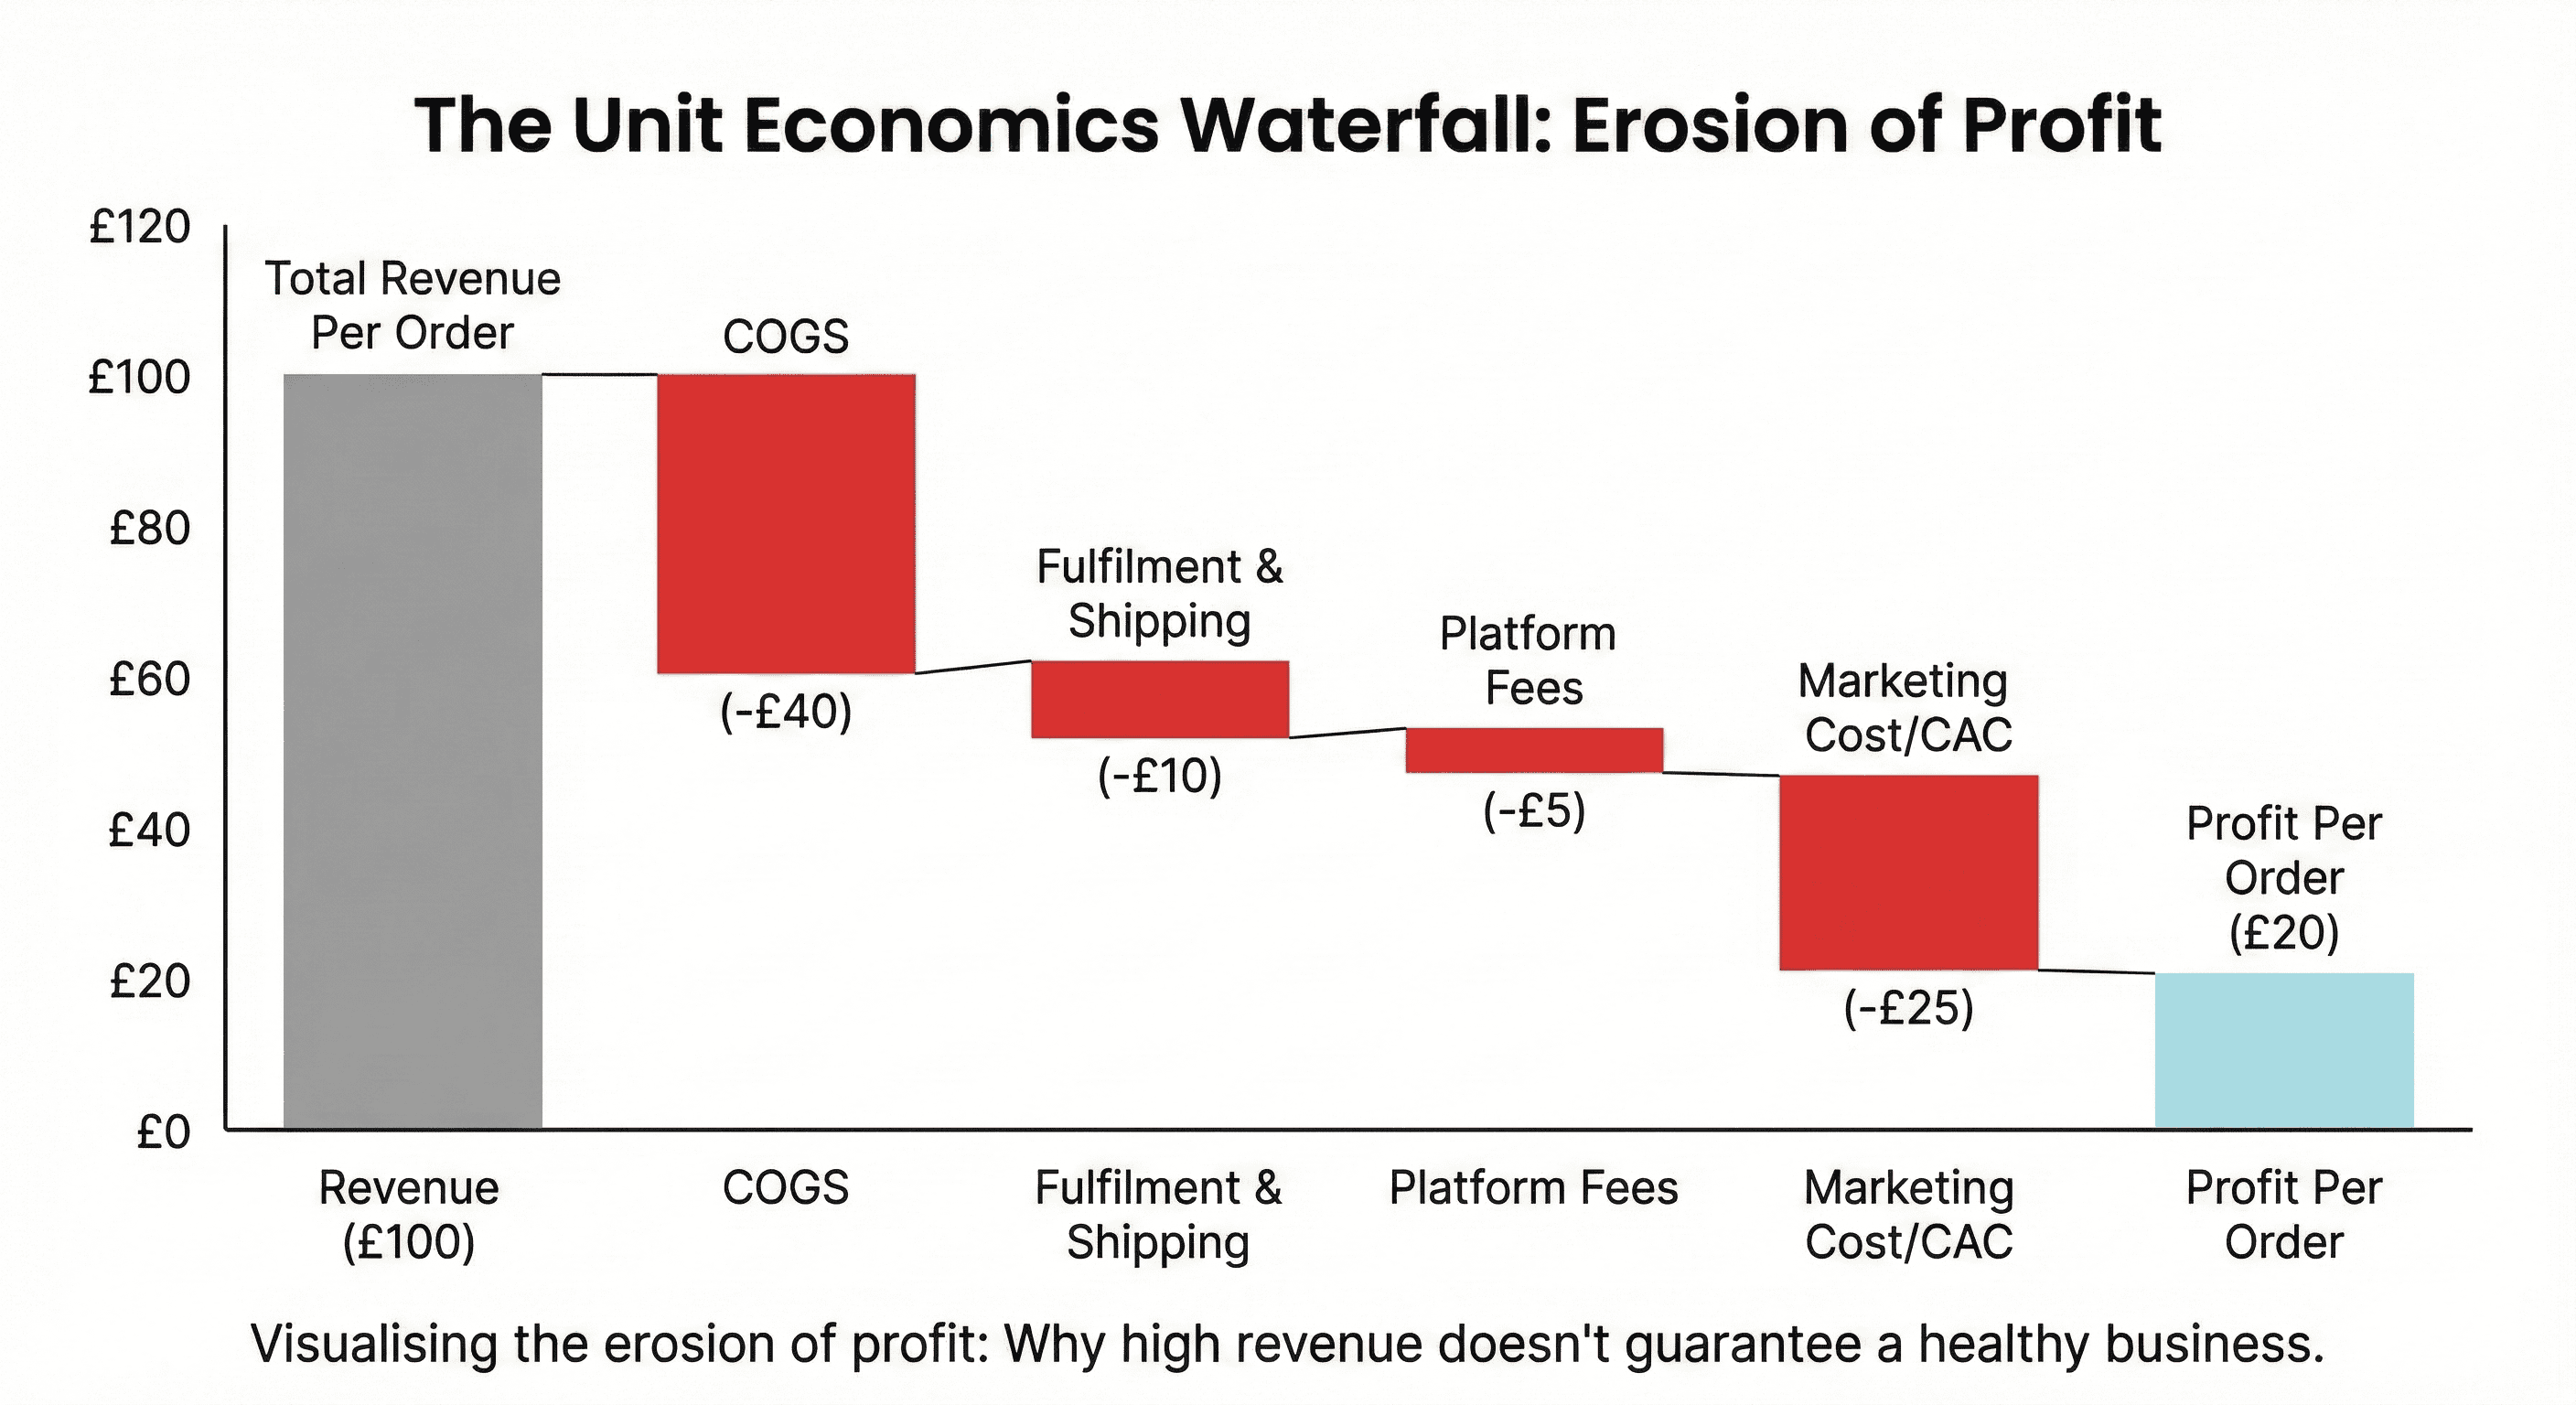
Unit Economics: The Bedrock of Profitability
Unit economics means understanding the profit and loss associated with a single customer or transaction.
Key components:
- Revenue per order
- Cost of Goods Sold (COGS)
- Fulfilment & shipping costs
- Marketing & ad spend attribution
- Platform and payment fees
Profit per order = Revenue − (COGS + Fulfillment + Fees + Attributed Marketing Cost)
This single formula drives almost every KPI that matters.
Customer Lifetime Value (CLV or LTV)
Customer Lifetime Value projects the total gross profit a customer is expected to generate over their “lifetime” with your brand.
There are several ways to calculate LTV:
- Historical LTV: based on past purchase behaviour
- Predictive LTV: uses modelling and cohort behaviour
- Segmented LTV: calculates by channel or campaign
Simple LTV formula (Basic): LTV = Average Order Value × Purchase Frequency × Gross Margin
This helps balance acquisition investments (CAC), especially when determining sustainable growth.
Contribution Margin vs. Gross Margin
- Gross Margin = (Revenue − COGS) / Revenue
- Contribution Margin = (Revenue − All Variable Costs) / Revenue
Contribution margin matters because it measures what’s left to cover fixed costs and deliver profit.
The KPI Stack That Predicts Profit
We’ll break KPIs into three channel systems: Paid, Organic, and Email. For each, you’ll get:
- Definitions
- Why it matters for profit
- How to calculate it
- Benchmarks
- How to interpret & optimise
Paid Marketing KPIs
Customer Acquisition Cost (CAC)
Definition: The average cost to acquire one customer through a specific channel or campaign.
Formula: CAC = Total Marketing Spend / Number of Customers Acquired
Example:
If you spent £20,000 on ads and acquired 400 customers, CAC = £20,000 ÷ 400 = £50
Why It Matters:
CAC tells you how much you’re paying for each new revenue generator. Paired with LTV, CAC tells you if your acquisition is profitable.
Target Rules of Thumb:
- LTV:CAC of 3:1 is generally healthy
- LTV:CAC of >4:1 is ideal for scaling
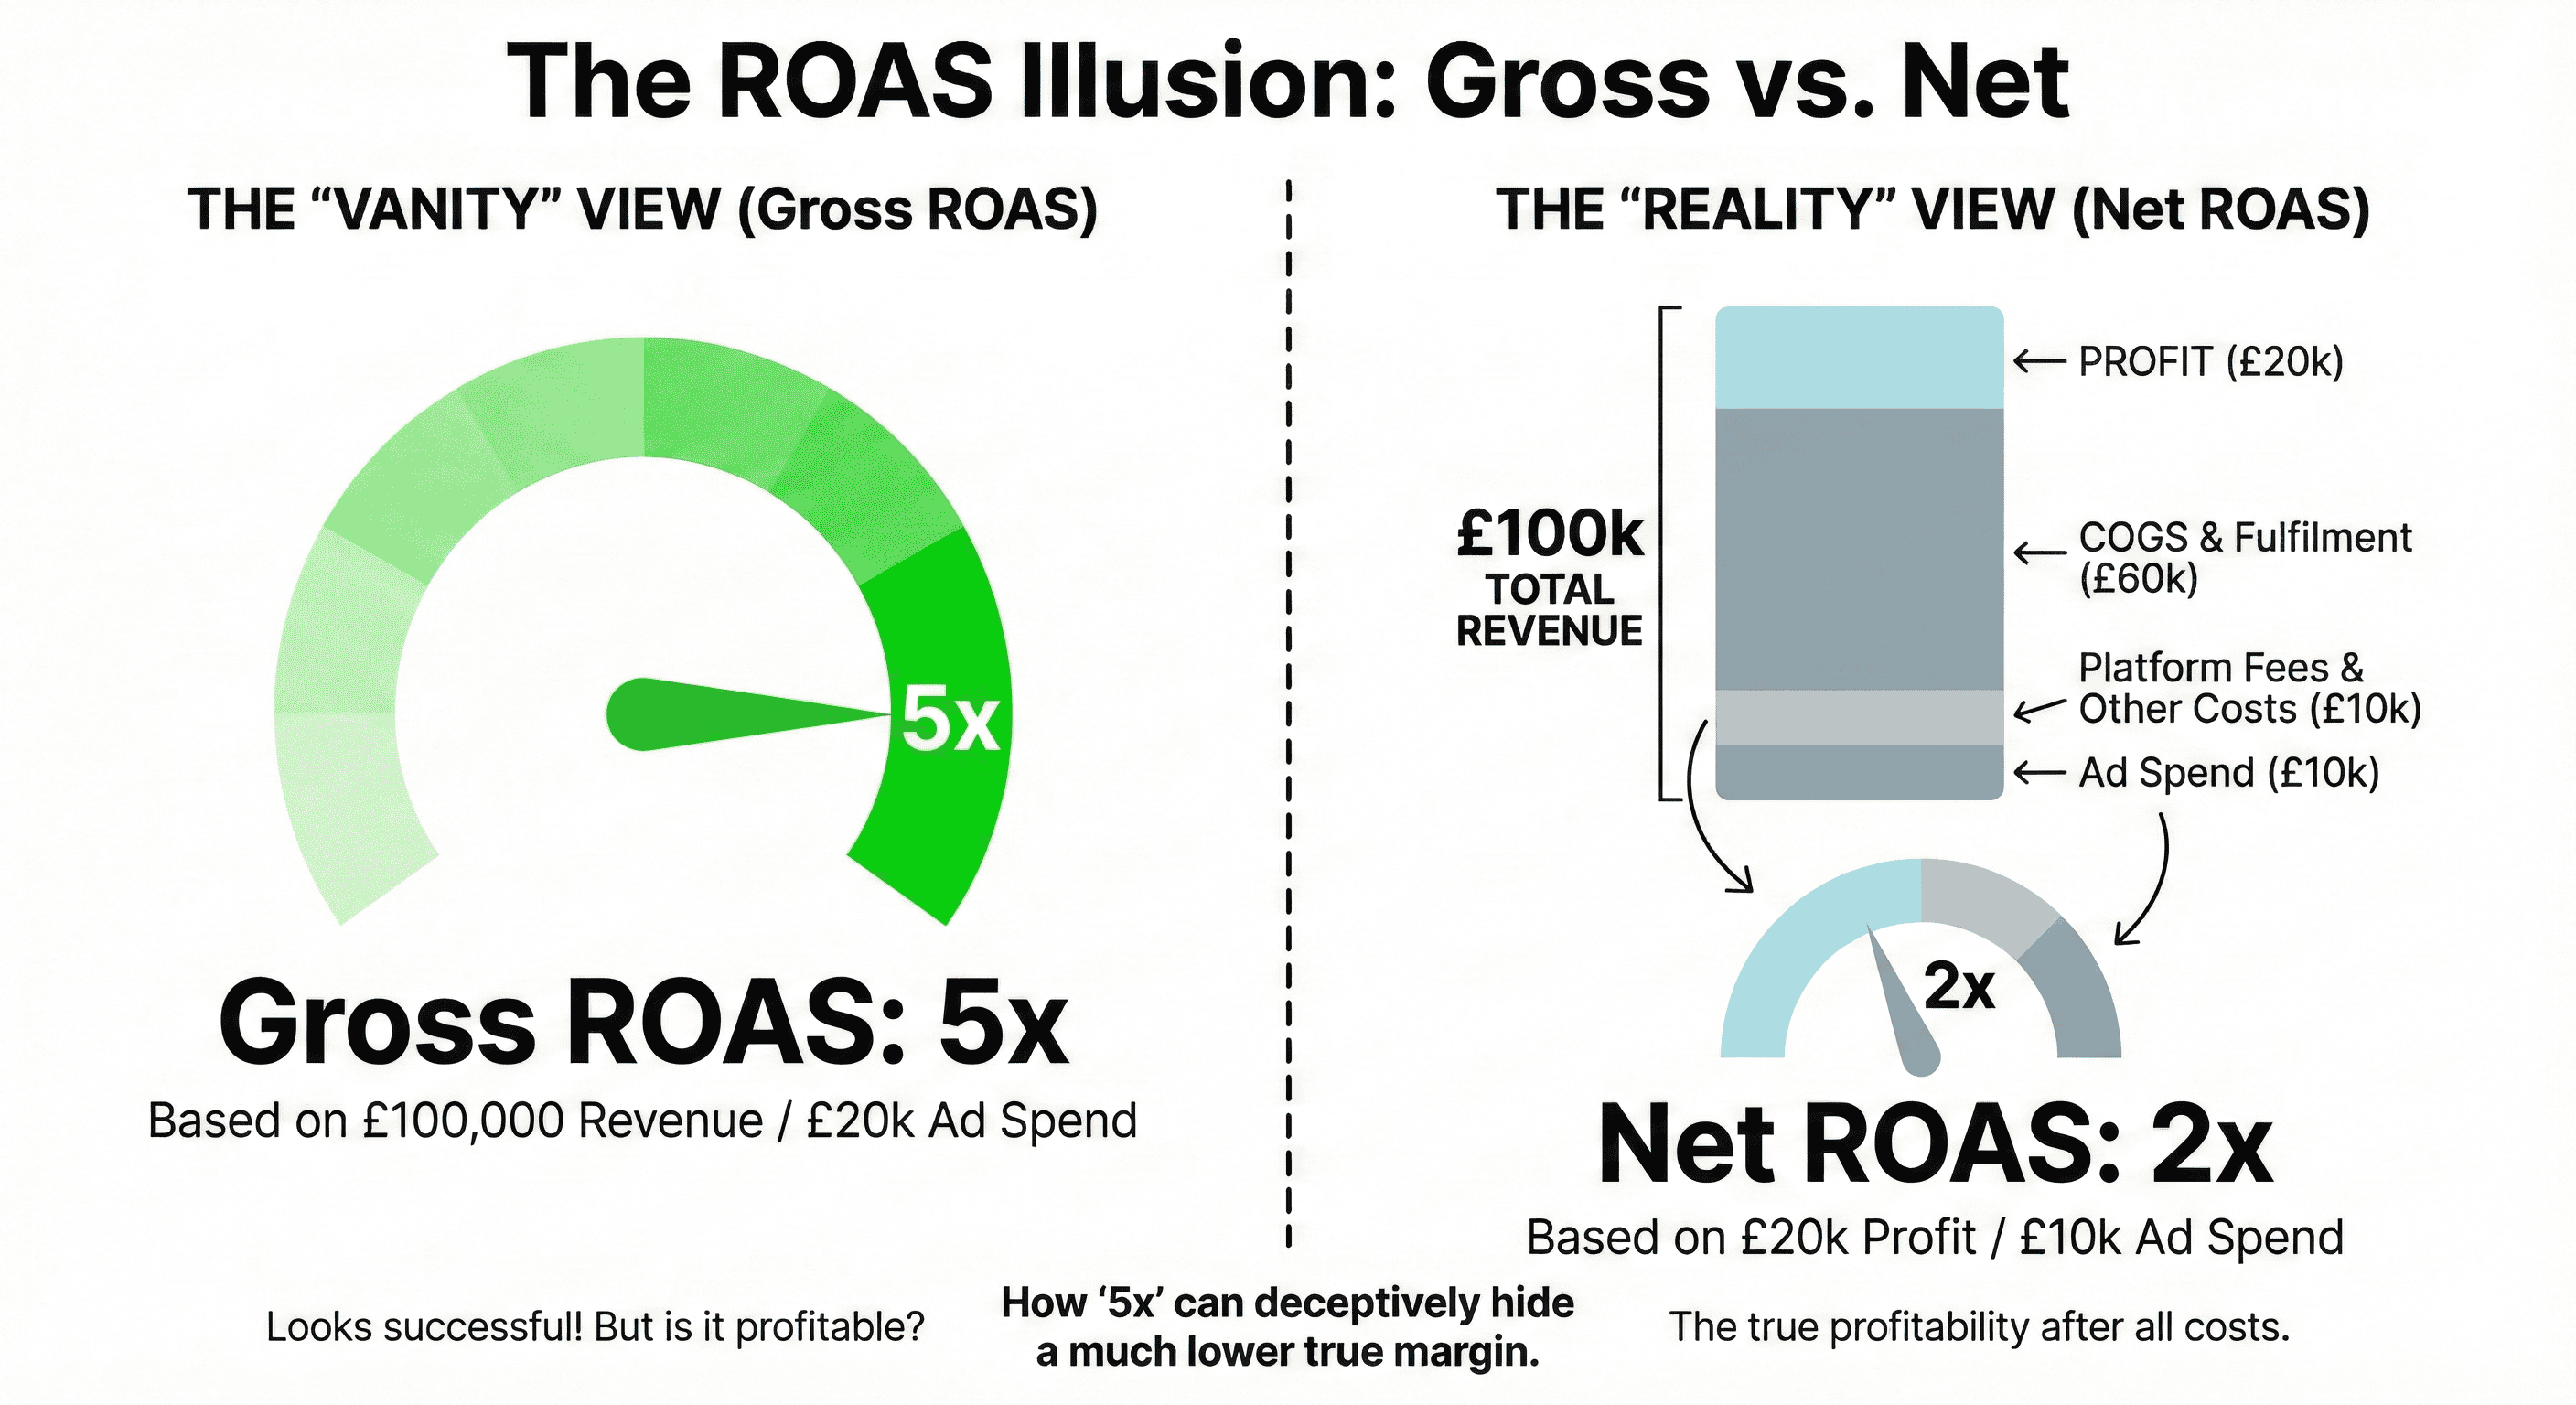
Gross ROAS vs. Net ROAS
Gross ROAS
Definition: Return on Ad Spend - total revenue per ad dollar.
Formula: Gross ROAS = Revenue from Ads / Ad Spend
Example:
£100,000 revenue from £20,000 spend → Gross ROAS = 100,000 / 20,000 = 5x
But does that mean profit? Nope.
Net ROAS - The Profit‑Focused Version
Definition:
Return on Ad Spend after subtracting all campaign‑related costs including COGS, fulfilment, fees, and attribution model costs.
Formula: Net ROAS = (Revenue − COGS − Fulfilment − Fees) ÷ Ad Spend
Example:
Revenue = £100,000
COGS + Fulfillment + Fees = £60,000
Ad Spend = £20,000
Net ROAS = (100,000 − 60,000) ÷ 20,000 = 2x
This tells you that for every £1 spent, you’re earning £2 in gross profit, not just revenue.
Profit Inference: If your net ROAS < 1, you lose money per ad dollar.
Why Net ROAS Matters:
Gross ROAS can be high even if margins are razor‑thin. Net ROAS reveals the truth.
Benchmark Targets:
- Net ROAS ≥ 2x is a basic profitability signal
- Net ROAS ≥ 3x is strong performance
Effective CAC (eCAC)
Definition: CAC adjusted for return rate, refund impact, and customer churn.
Adjusted CAC = (Ad Spend + Refunds − Returns Offset) / Customers
This more conservative CAC ensures you’re not overestimating profitability.
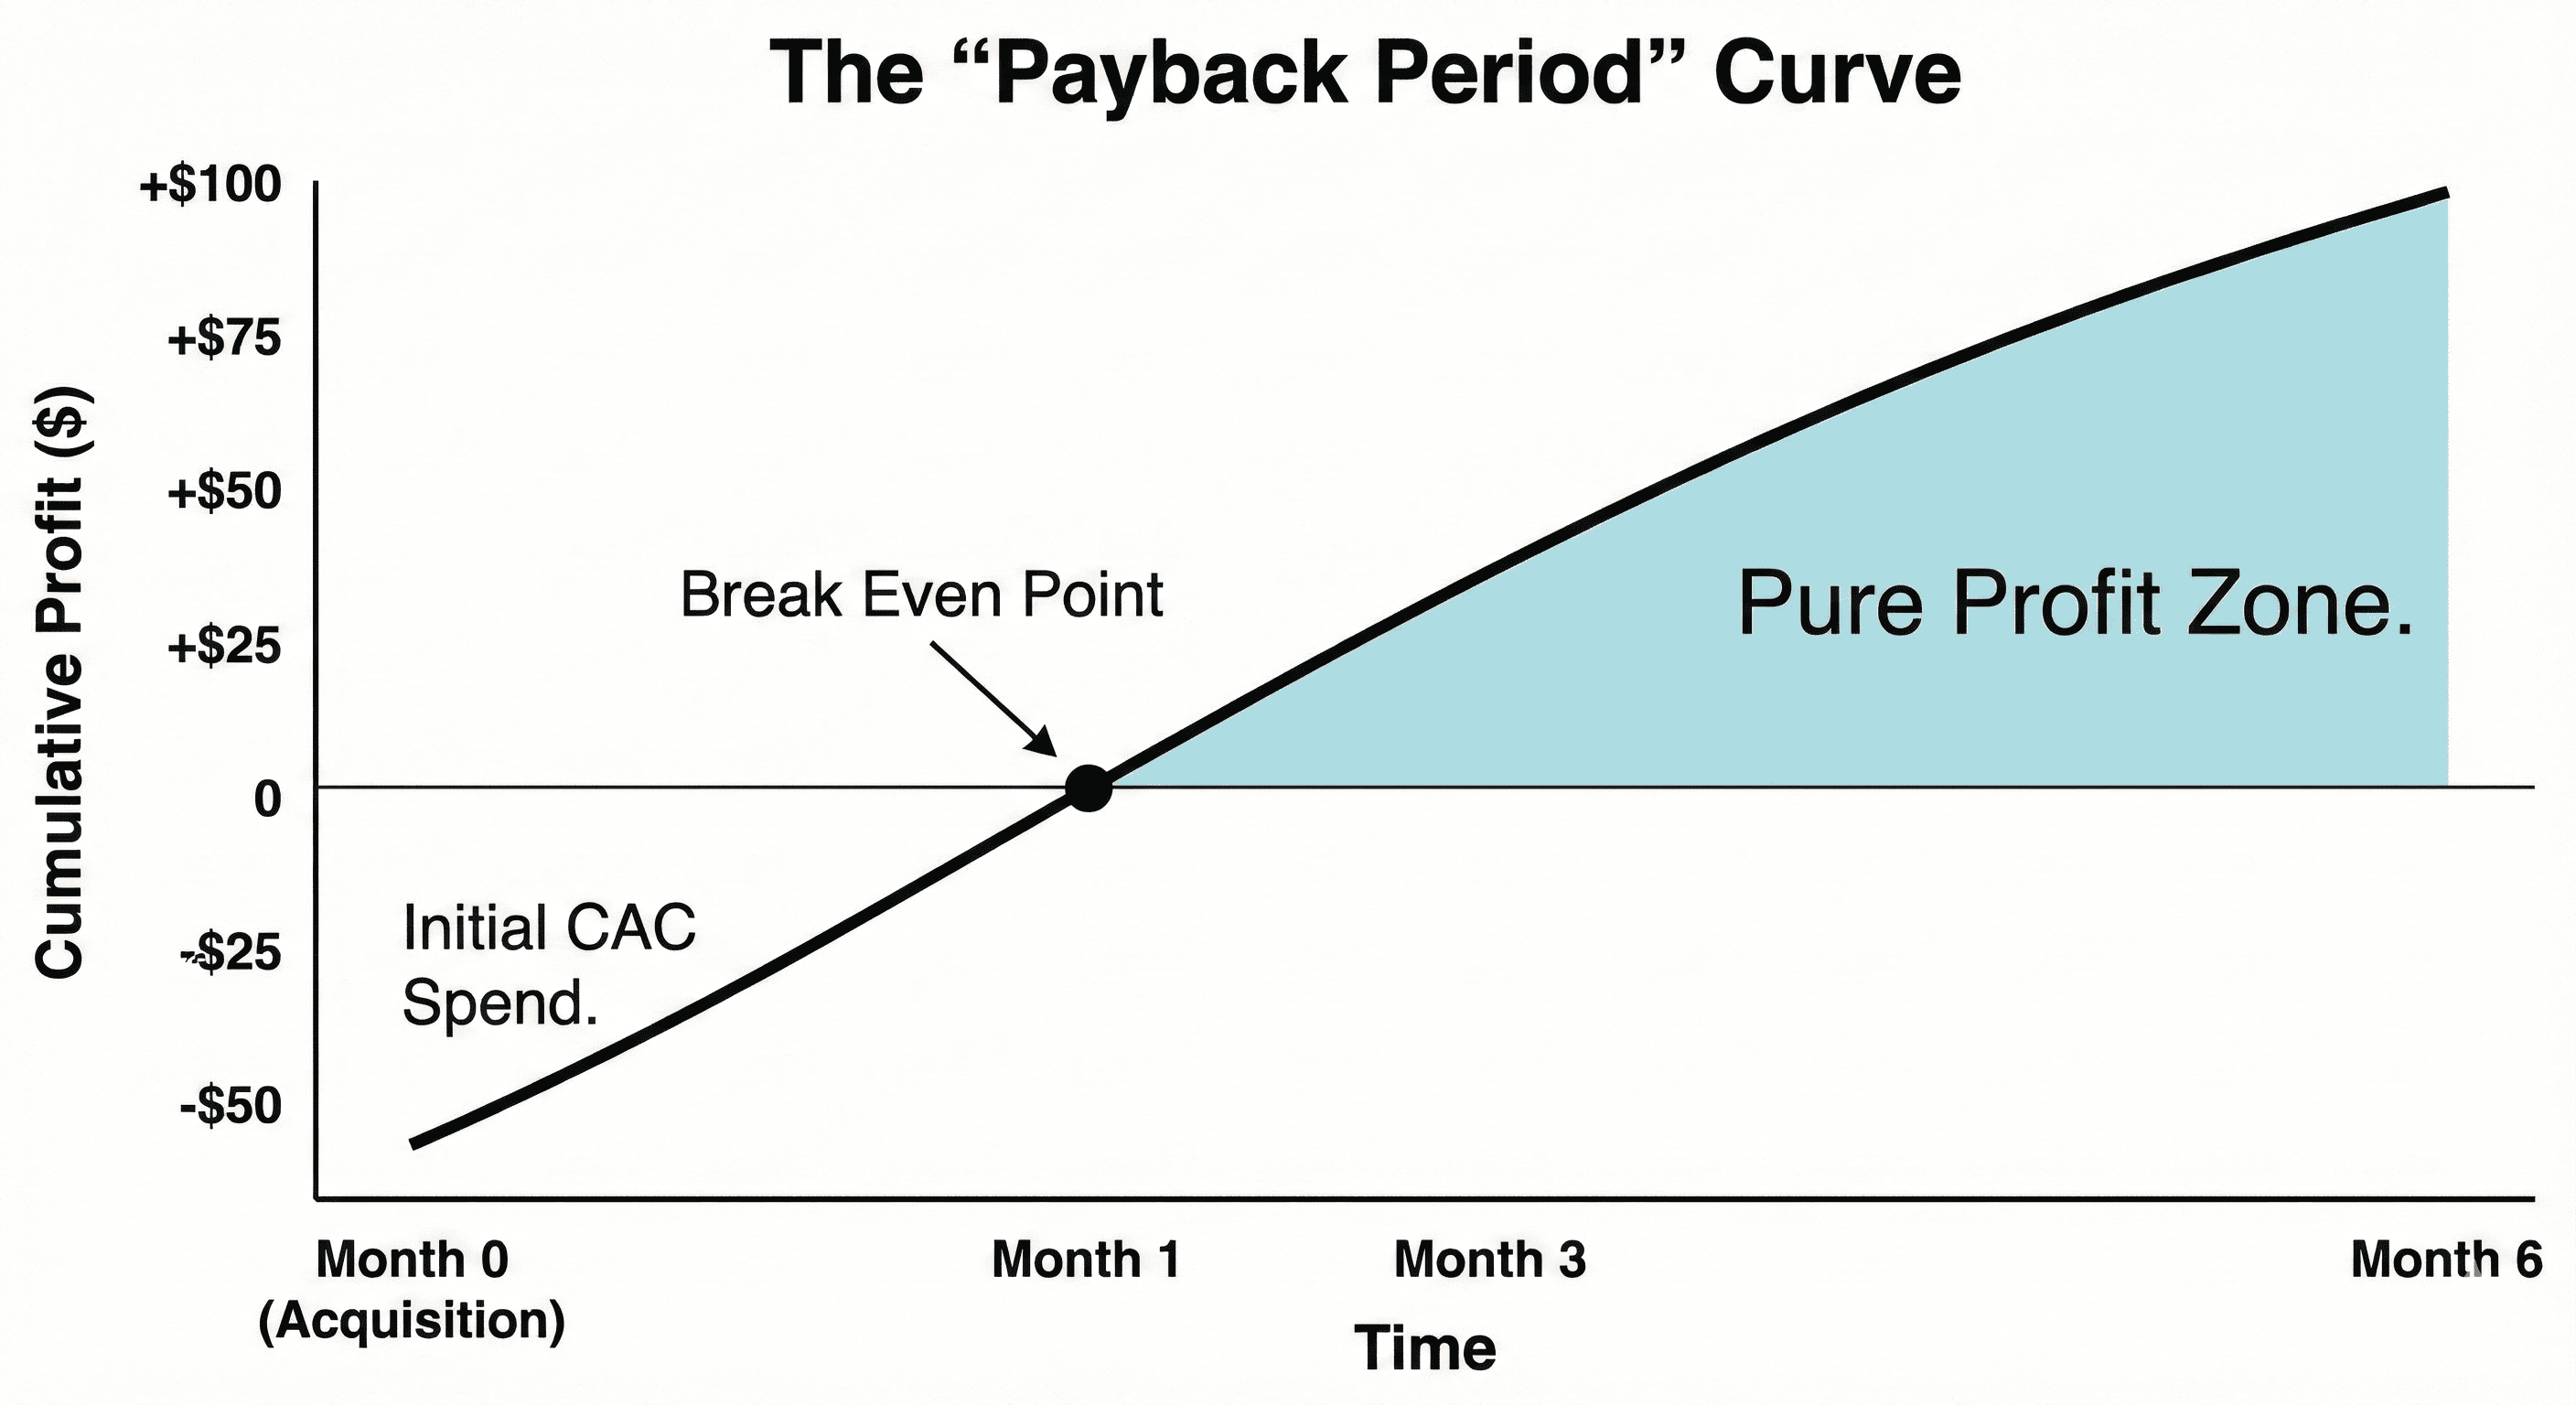
Payback Period
Definition: The time it takes for the profit from a customer to cover the CAC.
Formula: Payback Period = CAC / (Revenue per Customer × Gross Margin)
This predicts cash flow and informs budget pacing.
Cumulative Incremental Value (CIV)
Definition: Revenue caused by the campaign beyond what would have happened organically.
Tools & Models:
- Incrementality testing
- Holdout/control groups
Strictly required if you want your paid KPI modelling to avoid counting cannibalised conversions.
Organic Marketing KPIs
Organic Conversion Rate by Landing Page
Formula: Organic Conversions / Organic Sessions
Why It Matters: Shows which pages are profit contributors vs traffic generators that don’t convert.
Organic Average Order Value (AOV)
Formula: Organic Revenue / Organic Orders
Higher AOV often correlates with higher margin because organic traffic usually has higher intent.
Organic Funnel Progression Rate
Track how many visitors who enter through organic discovery ultimately purchase.
Search Visibility + Click‑Share
Use tools like GA4 + Search Console to measure actual clicks-to-revenue, not just impressions.
Email Marketing KPIs
Revenue Per Email Sent (RPE)
Formula: Total Revenue from Email / Number of Emails Sent
This is the true email ROI metric - clicks and opens don’t tell you revenue impact.
Targets:
- Small store: £0.50–£1.20 RPE
- Large store with segmented flows: £1.20–£3.00+
Repeat Purchase Rate (Email Cohort)
Formula: Customers with ≥2 purchases via email / Total email‑acquired customers
This directly ties email to retention value.
Email Engagement to Revenue Fraction
Percentage of total revenue from the email channel - a high indicator of brand loyalty.
Reporting Frameworks: Weekly, Monthly, Quarterly
Profit prediction is not just about tracking - it’s about frequency and context.
Weekly Framework
Weekly reporting provides tactical insights:
- Detect campaign performance swings
- Find early signs of optimisation opportunity
- Spot margin compression before it hurts
Track weekly:
- CAC per channel
- Net ROAS
- Conversion trends by source
- RPE
- Incrementality signals from tests
Monthly Framework
Monthly reporting adds strategic context:
- Trend smoothing
- Retention and customer quality
- LTV movement
Track monthly:
- Customer quality cohorts
- Repeat purchase rate
- Payback period trends
- Cumulative margin contribution
How to Build Your Lean Profit‑Predictive KPI Dashboard
Recommended Tools:
- GA4 (source-level insight)
- Post‑purchase surveys (incrementality)
- Email platform reporting (RPE)
- LTV/Cohort tools (Lifetimely, Triple Whale)
- Looker Studio Dashboard (cross-channel KPIs)
Dashboard Templates
Examples you might build:
- Paid KPI view: CAC vs Net ROAS vs Payback
- Organic KPI view: AOV vs Conversion vs Funnel Leakage
- Email KPI view: RPE vs Repeat Rate vs Lifetime Revenue
Pitfalls to Avoid
- Tracking CTR obsessively - doesn’t correlate with profit
- ROAS without margin data - misleading optimism
- Fragmented dashboards - siloed insight loses context
Advanced Techniques: Forecasting & Attribution
- Predictive LTV modeling
- Markov chain attribution for multi‑touch insights
- Holdout campaigns for true incrementality
Conclusion: KPI Discipline = Profit Confidence
When you focus on eCommerce metrics tied to margin, acquisition efficiency, and customer value, you transform dashboards from noise into profit steering instruments.
This isn’t just tracking - it’s managing eCommerce as a business with cashflow discipline.
Frequently Asked Questions
What is the most profit‑predictive KPI in eCommerce?
Net ROAS - because it adjusts revenue for all linked costs.
How often should I evaluate CAC?
Weekly for campaign pacing; Monthly for trend and scaling decisions.
Does high organic traffic predict profit?
Only if it converts at above the profit threshold and leads to repeat purchases.

Get in touch today
complete the form below for an informal chat about your business

We are a small, but perfectly formed, Digital Marketing Agency based in Stoke-on-Trent, Staffordshire. We provide services that help business owners make more money online.